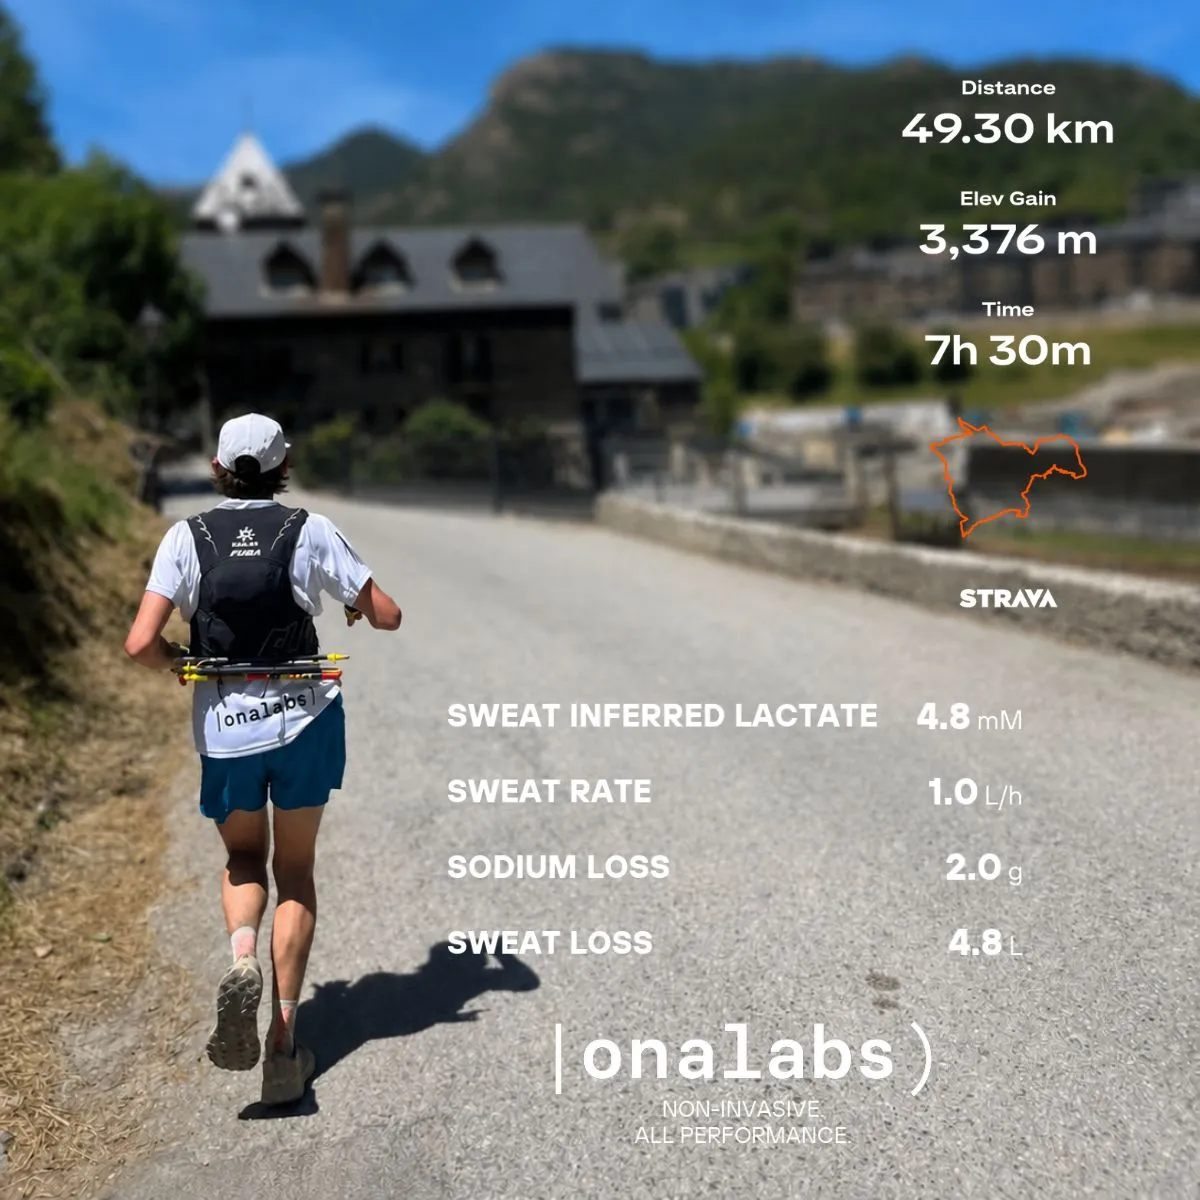
I've started plenty of races feeling strong — and come apart anyway, halfway up the last climb, cramping and light-headed while the race walked away from me. Fitness was never the whole story. The real culprit was usually something I couldn't see: how my body was managing its water and salt, minute by minute.
For years I did what every runner does about it — a mouthful here, a gel there, and a weigh-in after the finish to learn what I should have done. This year I stopped guessing. Across the spring and summer I recorded my sweat continuously and in real time through three races: a cold spring marathon, a scorching alpine 50K, and a fast summer race. Here is what the drops revealed.
Was I actually drinking enough?
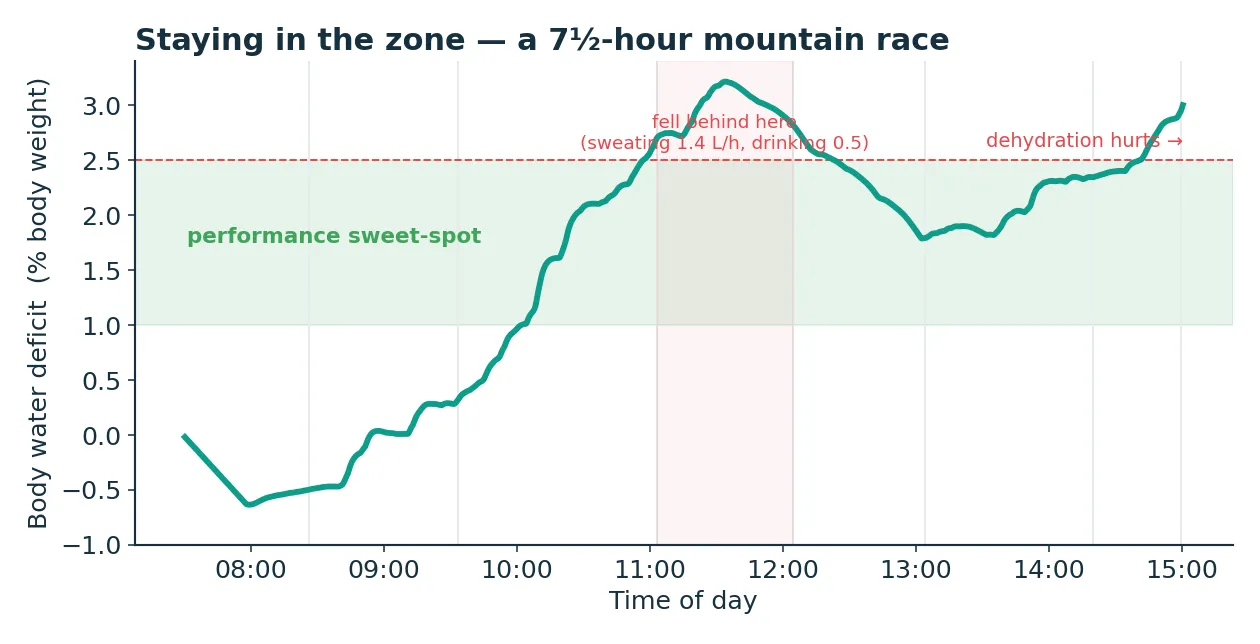
The number that really governs endurance isn't how much you drink — it's your net balance: sweat lost minus fluid taken in, as a share of your body weight. The science is clear about the target. Stay within roughly 1–2.5% and you hold your performance. Drift past 2–3% and pace, focus and heat tolerance all start to slide.
I drank a disciplined 5.5 litres across that 7½-hour, 50 km mountain race. By feel, I'd "drunk plenty." But played back against my live sweat, the data pinpointed the exact 90-minute climb where I'd quietly fallen behind — sweating 1.4 litres an hour while drinking only 0.5. No watch, no feeling, no post-race weigh-in could have told me which climb, or when.
| Leg of my race | Sweating | Drinking | Balance |
|---|---|---|---|
| Start → aid 1 | 0.4 L/h | 0.7 L/h | ahead |
| The big climb (aid 2 → 3) | 1.4 L/h | 0.5 L/h | falling behind |
| Mid-race (aid 4 → 5) | 0.4 L/h | 1.0 L/h | catching up |
The same heat, two very different days
Here's where it got surprising. Two of my races averaged almost the same temperature (~18 °C), yet one pushed my body into heat strain and the other didn't. What separated them wasn't the thermometer — it was the clock. The 50K climbed to 27 °C in its low valleys and lasted 7½ hours; the summer race touched 20 °C and was over in 90 minutes.
On the long day, whenever my sweat rate surged my heart had to work noticeably harder to hold the same pace — the tell-tale fingerprint of heat piling up faster than my body could shed it. On the short day, that fingerprint never appeared. Heat danger isn't just how hot — it's hot multiplied by how long. And my sweat signal saw it building while my legs still felt fine.
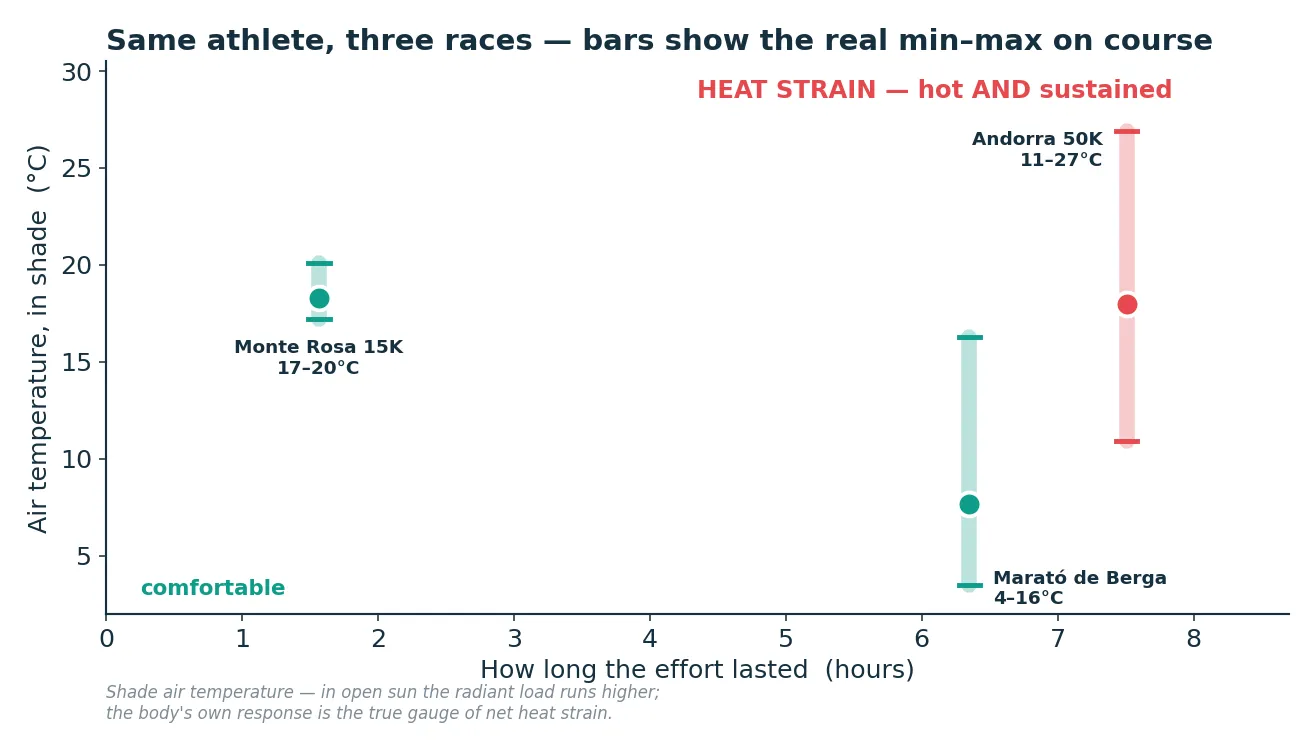
A note on the sun. These are shade air temperatures. On open, high-altitude courses under a clear sky — Andorra, and the exposed stretches of Monte Rosa — the direct sun added roughly +8–10 °C of radiant heat at skin level, so it genuinely felt like the mid-30s in the sunniest sections. Wind and dry air pulled the other way in Andorra.
And here is the part that turned a striking chart into something genuinely useful. I put a simple question to my own data: was my heart just tiring — the ordinary drift every runner feels late in a long day? It wasn't. For the same power output, my heart rate barely climbed across seven and a half hours; my pacing was that steady. But zoom into the exact minutes my sweat rate spiked, and my heart jumped with it — beating harder for no extra work, purely because of the heat. In the cold marathon that link vanished completely; if anything, my heart grew more efficient as the day wore on.
That's the difference between a number that tells me what happened and one that tells me why. A heart-rate strap alone would have shown a late-race rise and shrugged: "you're tired." Paired with live sweat, the same rise read clearly as heat cost — my cue to back off, cool down and drink before it became the cramp on the final climb.
My body is not a spreadsheet
The popular advice — "drink 500 ml an hour" — is a number pulled from an average that describes no one, and certainly not me. Follow it on my cold marathon and I'd finish sloshing and over-full. Follow it on the hot 50K and I'd cross the line more than 2% down, deep in the danger zone. Same rule, same runner, opposite mistakes.
| My race | When | Temp | Humidity | Duration | Verdict |
|---|---|---|---|---|---|
| Marató de Berga | May | 8 °C | 82% | 6.4 h | comfortable |
| Andorra 50K | June | 18 °C | 24% | 7.5 h | heat strain |
| Monte Rosa 15K | July | 18 °C | 49% | 1.6 h | comfortable |
My real hydration lives at the intersection of my sweat, this effort and today's weather. No formula can know that in advance — but a live reading tells me in the moment.
Watching myself adapt
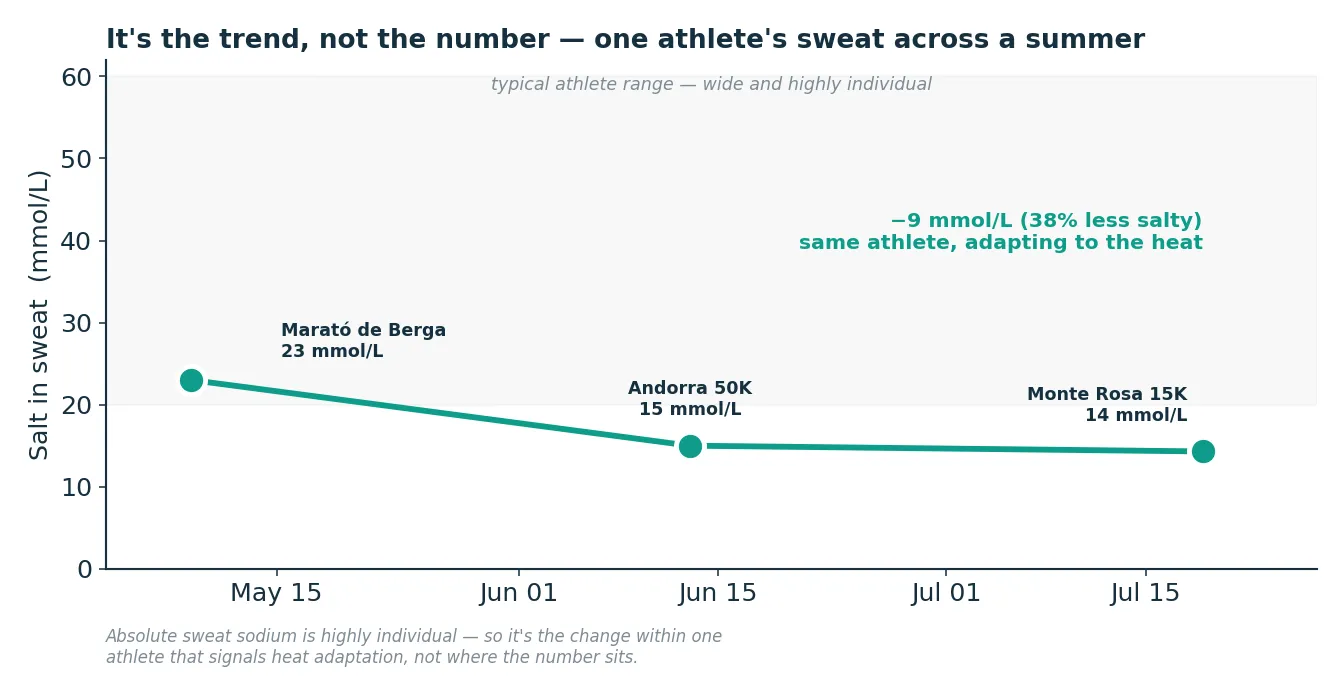
The most quietly remarkable thing came from the salt in my sweat. As the summer went on and I racked up hot days, my sweat became measurably less salty — dropping roughly 38% from race to race. That's the textbook signature of a body acclimatising to heat: it learns to hold on to precious sodium as it adapts.
And here's what I love about it: the exact number barely matters. How salty sweat is comes down to genetics, diet and how hard you're going — it's deeply personal, so my figure means little next to anyone else's. What means everything is my own line, moving. Sweat that gets less salty, week over week, is my body getting better at the heat — a training effect I can read in a drop, not guess at from a finish time.
The sense I was missing
Endurance has always been about listening to my body. What's new is that the conversation now has numbers. Knowing — in the moment — how much I'm losing, when the heat is starting to win, and how I'm adapting turns hydration from a post-race regret into a race-day decision.
I already train every sense I have. This is simply one more — the one that was invisible until now.